 ResearchRoom
Every figure your scripts draw, in one room.
ResearchRoom reads the figures and tables your project already writes and lays them out as cards: one per plot, its versions and variants behind switches, grouped by the day you read them. It runs on your own machine, over your own folders.
Free and open source. Python 3.11 or newer, standard library only.

The demo is a made-up study of a minimum-wage rise in an invented region. Every number in it is invented.
Name your files, and the room sorts them.
Save each output as N_name_vK: the number of the script that drew it, a name, a version. Every version of a name becomes one card, newest first, with older ones a click away and marked superseded. A small sidecar file beside a figure puts its variants, such as outcomes, samples or bin widths, on switches.
Click a file, or a switch on the card.
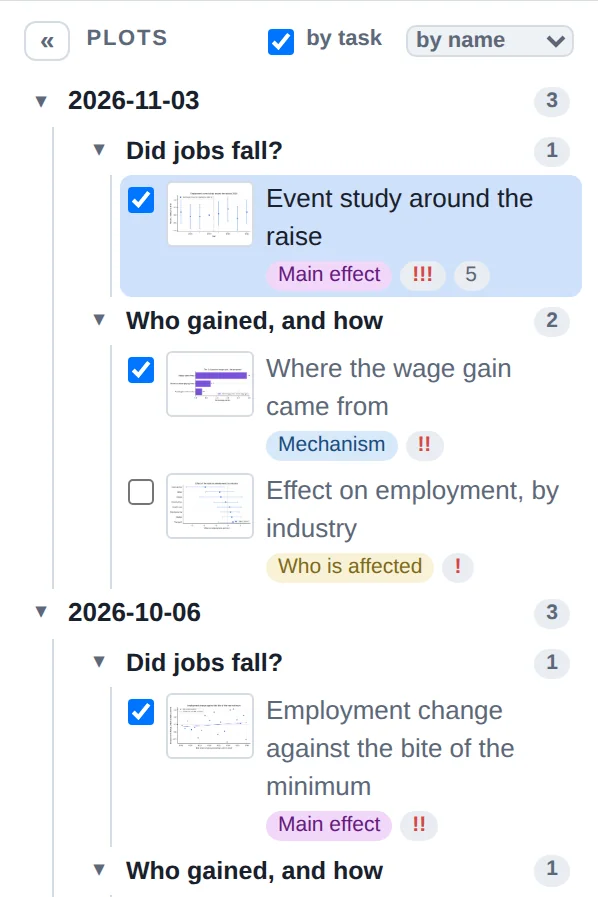
Grouped by when you read them
Each read-out you save in docs/runs/ starts a group in the tree, so a batch of new results lands together. The tasks set at a meeting split each group, and tags and an importance mark keep the plots someone asked for in view.
Each plot explains itself
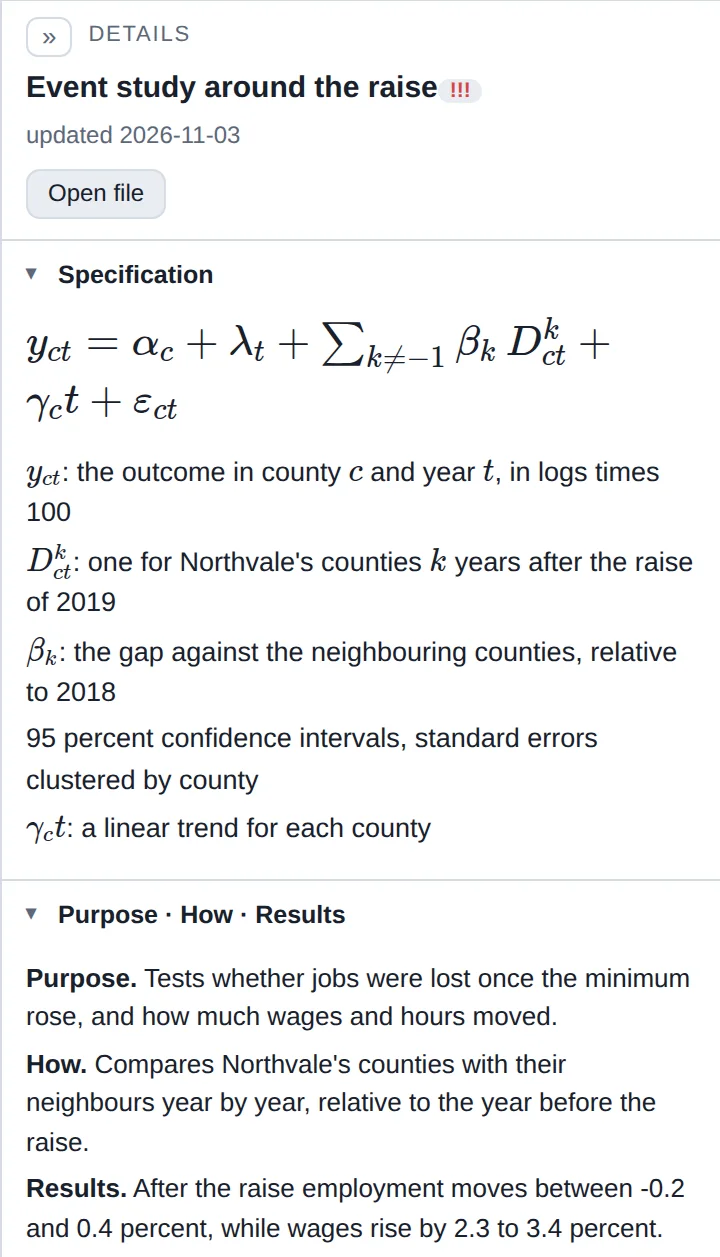
Beside every card sit the estimating equation, typeset from one line of TeX; three sentences on purpose, method and result, which you approve; and the caption your script wrote. The room flags any number in the result sentence that the caption does not give, and a redrawn figure marks its sentences out of date.
Share a read-only copy
Export the room as static files and publish it on Cloudflare Pages behind Cloudflare Access. Coauthors see every figure and table and run nothing. Publishing refuses to deploy unless the login still guards every address.
Results from a secure data site
Outputs that come back from a restricted-data enclave, in out/<run>/RELEASE/, join the room dated by the read-out that brought them back.
Ask Claude about a plot
An optional panel answers questions about the plot in focus with Claude Code, on your own login. It is for the project's owner only: the published copy has none.
Try it on the example.
git clone https://github.com/roykisluk/ResearchRoom ResearchRoom
python3 ResearchRoom/room/dashboard.py --project ResearchRoom/example
# then open http://127.0.0.1:8765/room
You need Python 3.11 or newer, and poppler to show PDF figures. For your own project, clone ResearchRoom beside it and run python3 ../ResearchRoom/room/dashboard.py --project . from the project's folder. Nothing leaves your machine unless you publish it.